
The Financial Reality of the British State: From Westminster to the Town Hall
Part Three: Where the Spending Goes
National spend by category first, then the three services actually shaping everything found in Part Two — social care, SEND, and tertiary education, deliberately in place of the more obvious transport story.
What this piece shows, in three findings
- Social care isn’t one line item among many — it’s becoming the whole budget. For county councils specifically, it now consumes almost two-thirds of everything they spend.
- SEND demand has grown every single year since the system began, with no sign of levelling off. This isn’t a temporary spike to manage — it’s a structural feature of the current settlement.
- Universities matter most exactly where they’re least visible in the national picture. London and the South East see the largest absolute jobs impact, but the relative impact — the share of a whole town’s economy resting on one institution — is highest in the places already found to be struggling in the earlier pieces of this series.
1. The national picture
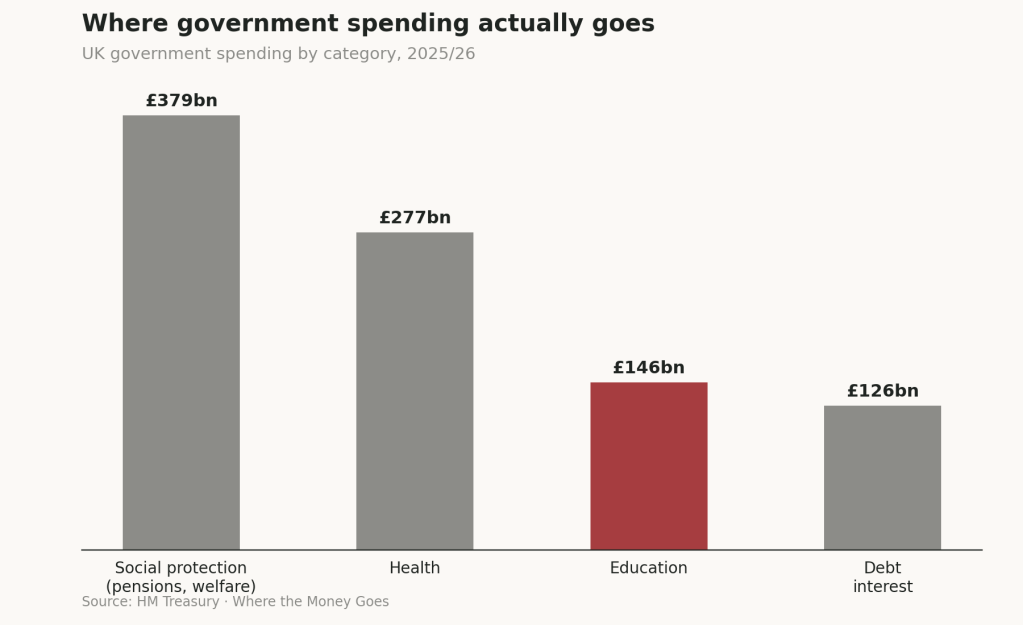
- Social protection is by far the largest category of government spending, at £379bn — more than health and education combined.
- Health has grown from around 4% of GDP to over 7% since the 1980s, while defence has fallen from 4.6% to 1.8% over the same period — a genuine, decades-long reallocation of the state’s priorities.
2. Social care — the budget that swallows everything else
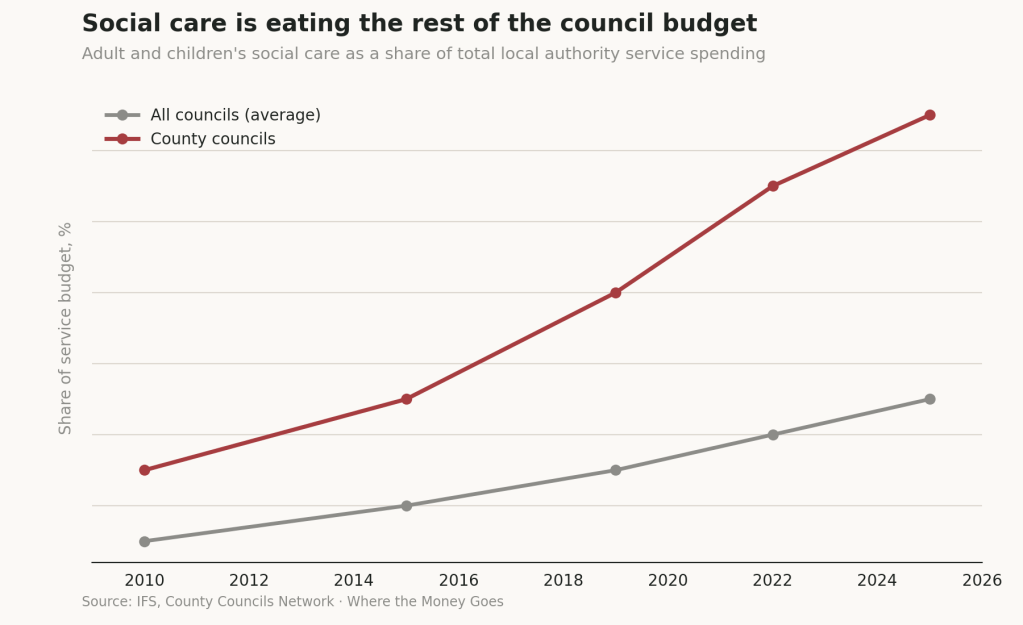
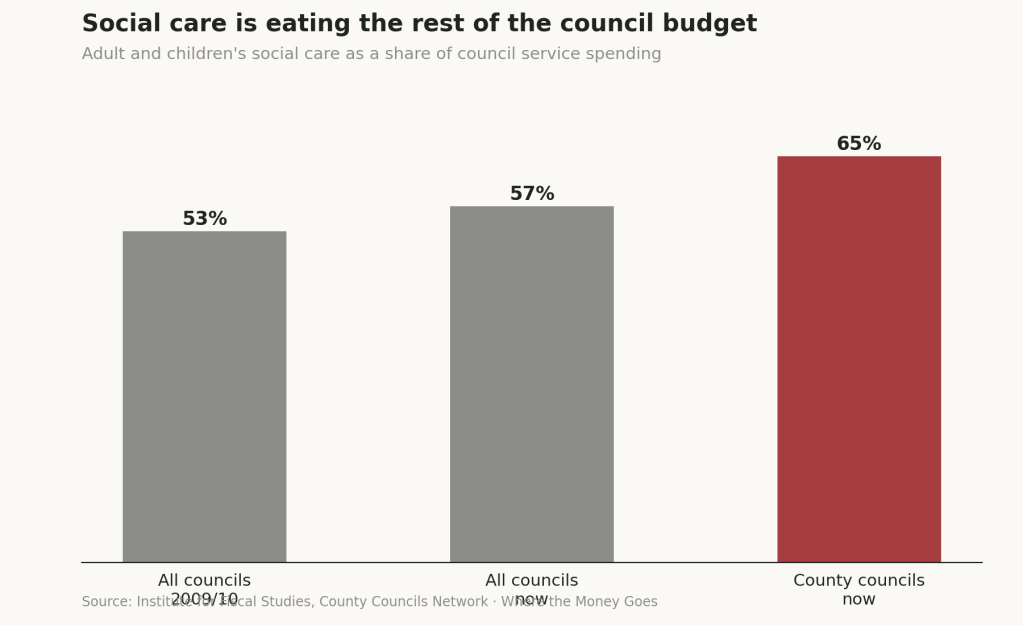
- Adult and children’s social care combined now account for around 57% of the average council’s service spending, and around 65% for county councils specifically.
- Total adult social care expenditure reached £34.5bn in 2024/25, an 8% increase on the previous year alone — spending is genuinely rising, driven by demand rather than generosity.
- This single fact explains most of Part Two’s findings. A budget line that consumes two-thirds of a county council’s spending doesn’t leave much room for anything else — including the parks, libraries and planning capacity examined in that piece.
3. SEND — demand with no ceiling in sight
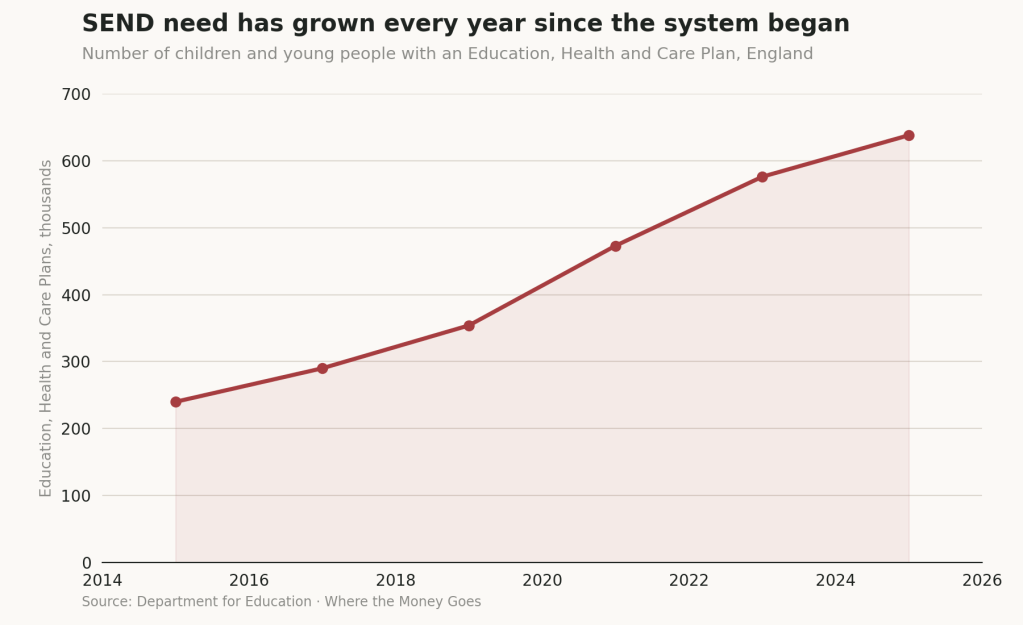
- The number of children with an Education, Health and Care Plan has risen every single year since the system began in 2014, reaching nearly 640,000 by January 2025.
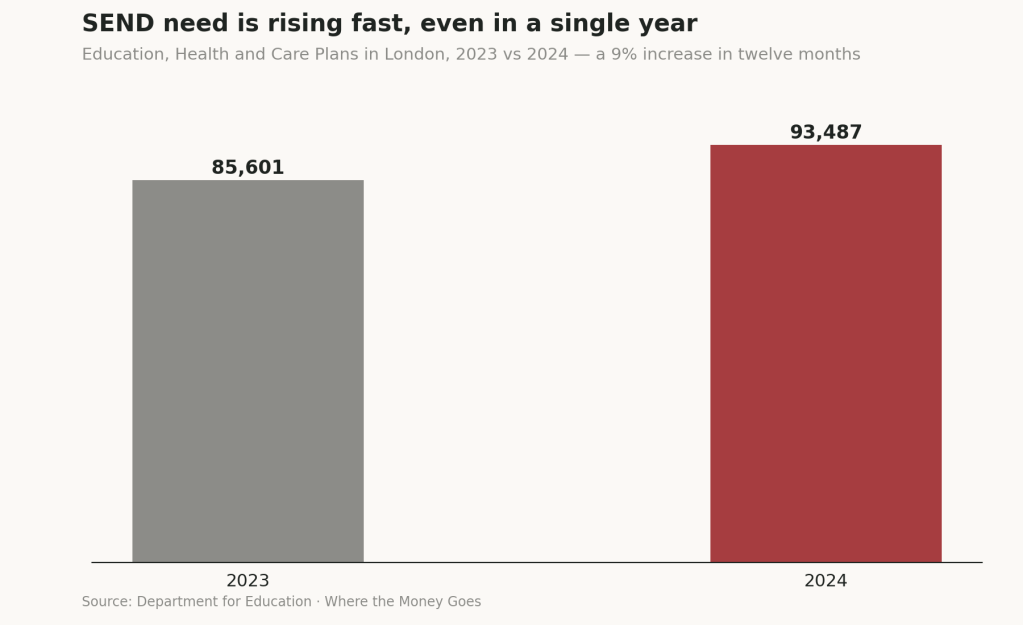
- London has seen particularly sharp growth — a 9% increase in EHCPs in a single year (2023 to 2024) — with up to 16 London boroughs now considered at risk of insolvency from SEND deficits alone.
- This is the demand side of the deficit mechanism examined in Part Two. The funding gap isn’t a result of mismanagement; it’s the direct, near-inevitable consequence of a legal entitlement that keeps growing against a funding settlement that doesn’t automatically grow with it.
4. Tertiary education — invisible where it matters most
- Universities support around 1.2 million jobs across the UK, with the largest absolute numbers unsurprisingly in London (188,000) and the South East (155,000).
- But relative impact tells a completely different story. In Plymouth, Middlesbrough, Stoke and Swansea, over 5% of all local jobs are tied to the local university. In St Andrews, a third of the entire population is students, supporting over 4,000 jobs directly.
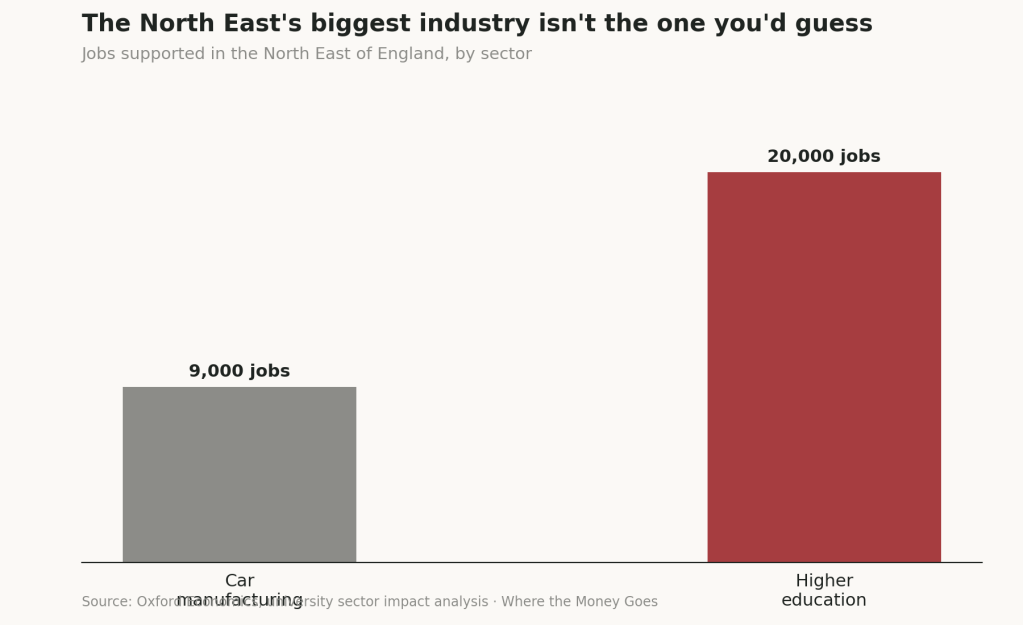
- In the North East, more people work in higher education (20,000) than in car manufacturing (9,000) — a genuine reversal of the region’s own industrial self-image, and a fact almost nobody there would guess unprompted.
- The wage effect is real too: average salaries at the University of Sunderland run over a third higher than the city average.
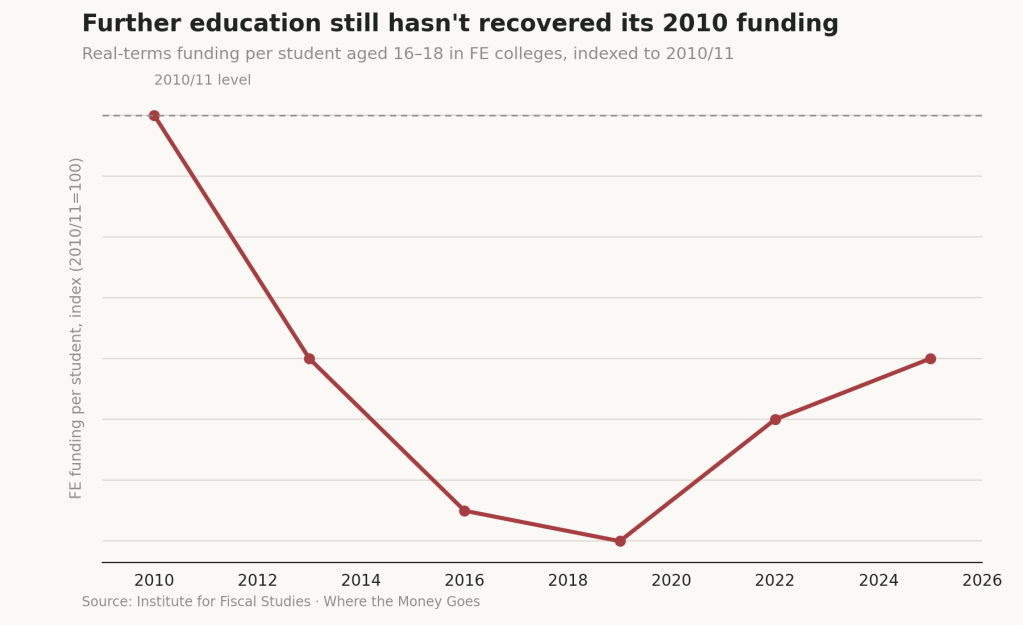
- Funding per student in further education colleges remains around 8% below its 2010/11 level in real terms, even after recent increases — the deepest and slowest-recovering cut across the entire education system.
- Adult skills and apprenticeship spending overall is still 25% below its 2010/11 level, and classroom-based adult education specifically remains around 54% below — a genuinely severe, still largely unrecovered decline.
- The Apprenticeship Levy, meant to fund exactly this kind of training, has left roughly £1bn a year unspent— only 1 in 25 employers use their full allocation, the funds expire unused after 24 months, and the scheme is being replaced by the more flexible Growth and Skills Levy from April 2026.
- The institutions that do the most good per pound are currently under the most financial strain. Kent and Greenwich are merging into what’s being called the UK’s first “super-university,” a move widely seen as a template for other financially stretched institutions to follow.
A note on the data
Social care and SEND figures come from the IFS, the County Councils Network, the Local Government Association and the Department for Education. The university economic-impact figures draw on Oxford Economics’ sector analysis. Chart 2 (social care’s share of council budgets over time) and Chart 3 (EHCP growth) are built from published anchor figures rather than a full continuous annual dataset — the endpoints are sourced, the path between them is a reasonable construction rather than raw data, and worth a precision check before publication.
Next in this series: The Household Ledger — seven composite households, built from the deciles and regions established across these first three pieces, showing what all of this actually looks like at the kitchen table.


Leave a Reply