The Financial Reality of the British State: From Westminster to the Town Hall
Part Two: Where the Revenue Comes From
National tax composition first, then the local government finance layer underneath it — because the headline tax figures tell you almost nothing about the crisis actually unfolding in town halls.
What this piece shows, in three findings
- The tax system is dominated by two taxes on work. Income tax and National Insurance together raise more than VAT and corporation tax combined — the system leans heavily on earnings, not wealth or consumption.
- Local government has been quietly and dramatically recentralised. Councils now depend on council tax for more of their funding than on central grant — a reversal of the position in 2010 — while business rate-setting, which councils controlled outright before 1990, remains almost entirely centrally determined.
- The funding crisis isn’t evenly spread, and it isn’t accidental. The councils hit hardest by a decade of cuts were disproportionately the ones already most dependent on central grant — and the same pattern, in reverse, is now shaping a genuine rebalancing that most people have no way of seeing.
1. National tax composition
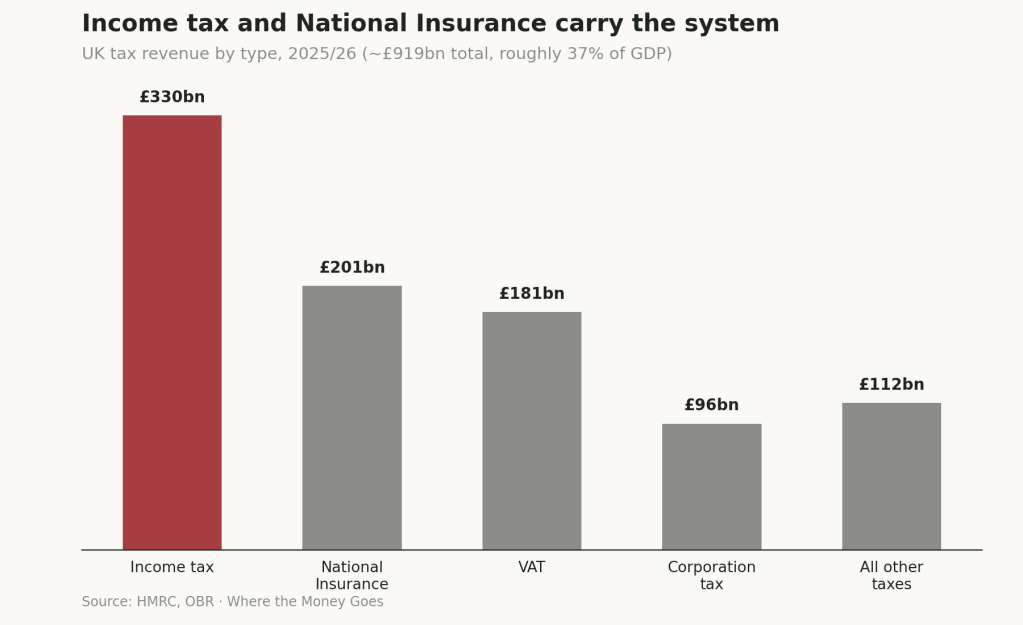
- Income tax is the single largest tax, at £330bn — roughly 11% of GDP on its own.
- Income tax and National Insurance together dwarf VAT and corporation tax. The system is built primarily around taxing earnings, not spending or corporate profit.
- The UK’s overall tax take sits in the middle of the pack internationally — 21 of 38 OECD countries raise a larger share of GDP in tax (34.4%, against an OECD average of 34.1%), 16 raise less. The gap with higher-taxing European neighbours is mainly explained by lower National Insurance contributions than their equivalent social security systems.
- The top 10% of income taxpayers contribute over 60% of all income tax revenue — the system is progressive in this specific, measurable sense, whatever else is true about the wider tax and benefit picture.
Tax Revenue as a Share of GDP, OECD Countries (2024)
| Rank | Country | Tax Revenue (% of GDP) |
|---|---|---|
| 1 | Denmark | 45.2% |
| 2 | France | 43.5% |
| 3 | Austria | 43.4% |
| 4 | Italy | 42.8% |
| 5 | Belgium | 42.6% |
| 6 | Finland | 42.2% |
| 7 | Luxembourg | 41.5% |
| 8 | Sweden | 41.4% |
| 9 | Norway | 40.2% |
| 10 | Greece | 39.8% |
| 11 | Netherlands | 38.5% |
| 12 | Slovenia | 38.3% |
| 13 | Germany | 38.0% |
| 14 | Iceland | 36.9% |
| 15 | Spain | 36.7% |
| 16 | Poland | 36.6% |
| 17 | Slovak Republic | 35.6% |
| 18 | Estonia | 35.2% |
| 19 | Portugal | 35.1% |
| 20 | Canada | 34.9% |
| 21 | Latvia | 34.9% |
| 22 | United Kingdom | 34.4% |
| 23 | Hungary | 34.4% |
| 24 | Czechia | 34.0% |
| 25 | Japan | 33.7% |
| 26 | Lithuania | 33.1% |
| 27 | New Zealand | 32.9% |
| 28 | Israel | 30.9% |
| 29 | Australia | 29.9% |
| 30 | Switzerland | 27.2% |
| 31 | United States | 25.6% |
| 32 | South Korea | 25.3% |
| 33 | Costa Rica | 24.8% |
| 34 | Türkiye | 24.0% |
| 35 | Ireland | 21.7% |
| 36 | Chile | 20.5% |
| 37 | Colombia | 19.9% |
| 38 | Mexico | 18.3% |
| — | OECD Average | 34.1% |
Source: OECD Revenue Statistics 2025, via Visual Capitalist.
2. Local government funding — the centralisation story
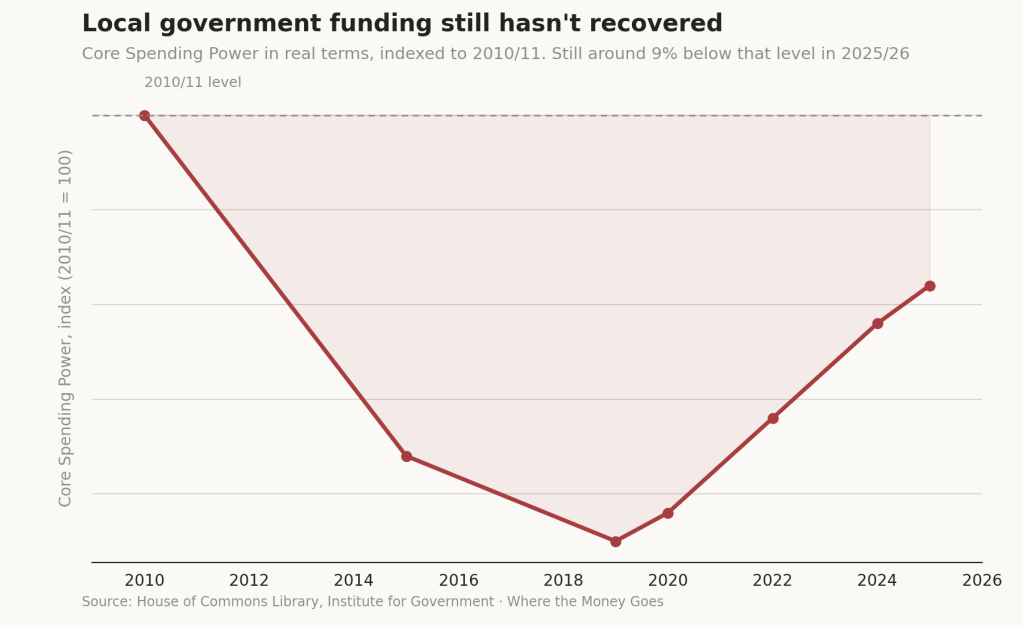
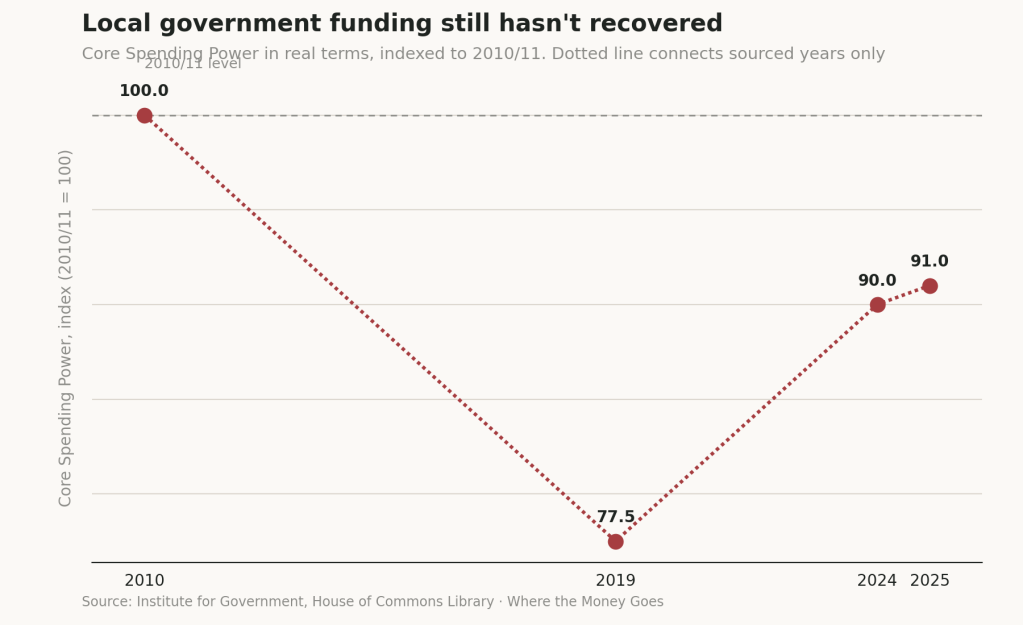
- Local government funding remains around 9% below its 2010/11 level in real terms, even after several years of increases — a gap that has narrowed substantially since its low point but has not closed.
- The scale of the original cut was severe: central grant funding fell by 40.1% in real terms between 2009/10 and 2019/20, from £51.8bn to £31.0bn.
- Only 5% of UK tax revenue is collected by local government, against 14% in France and 15% in the United States — one of the most fiscally centralised systems among comparable countries.
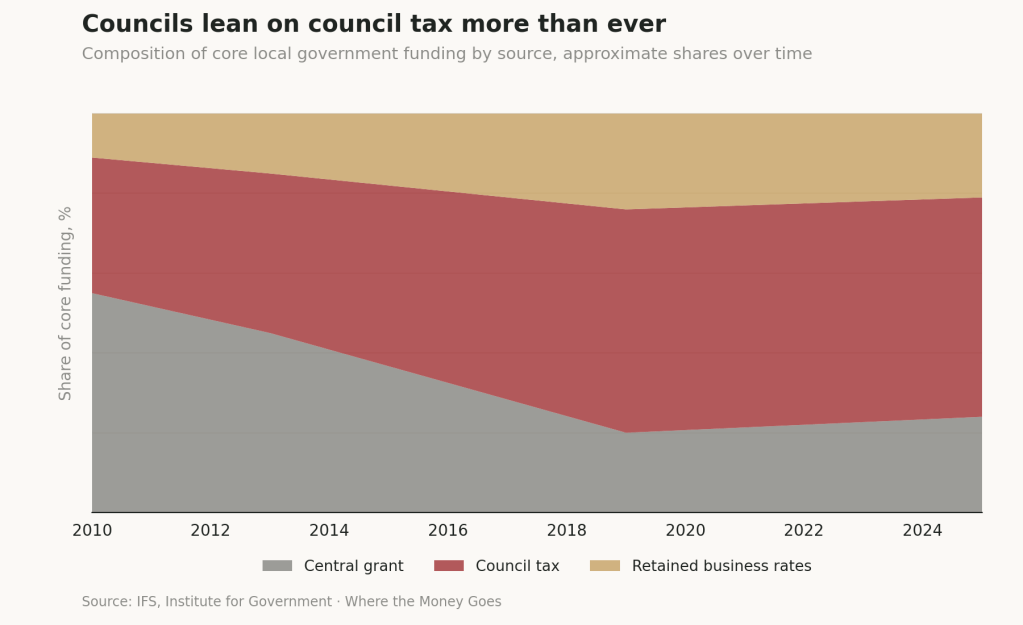
- Council tax has gone from a supplementary source to the dominant one. Its share of core funding rose from around a third in 2010/11 to over half by the end of the decade.
- Business rates were locally set and locally retained before 1990. The Local Government Finance Act 1988 removed that power entirely, pooling the revenue nationally — a specific, dateable political choice, not an inevitability.
3. Who the cuts hit — and who the recovery is helping
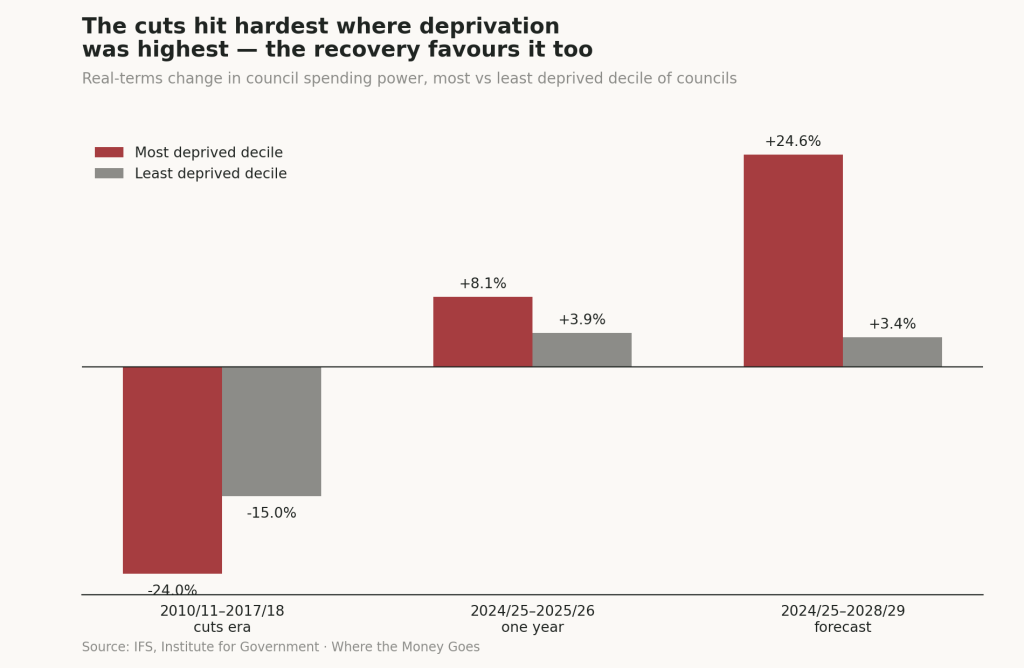
- The cuts of the 2010s fell hardest on the most grant-dependent councils. Spending per person in the most deprived fifth of councils fell from 1.52 times the level in the least deprived fifth to 1.25 times, between 2010/11 and 2017/18 — the gap between rich and poor council areas narrowed because the poorer areas lost more, not because the richer areas gained less.
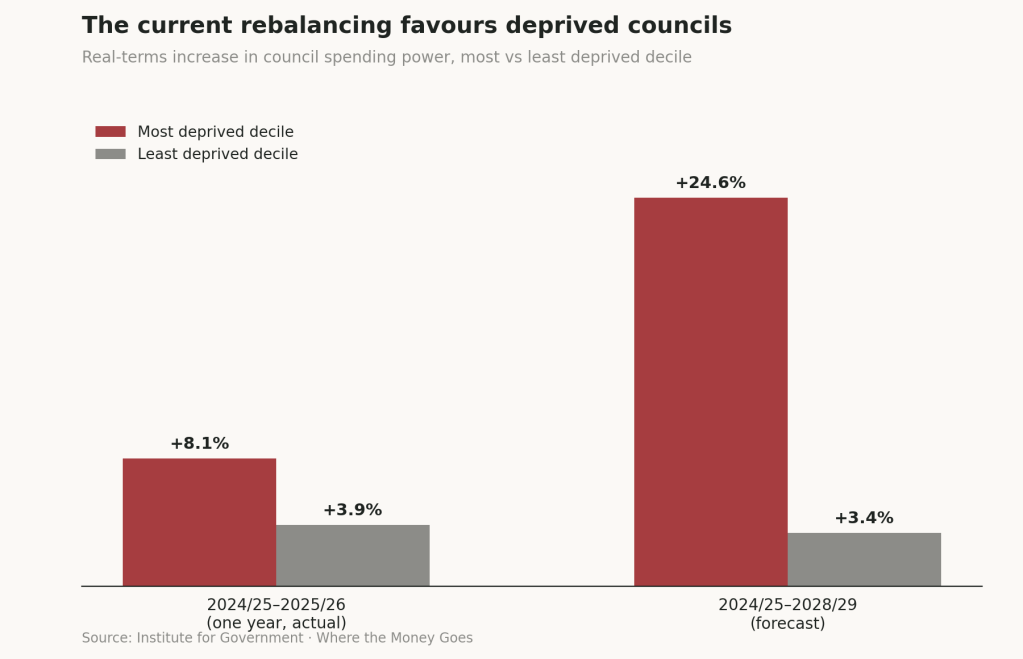
- A genuine rebalancing is now under way. The most deprived decile of councils saw an 8.1% real-terms funding increase in 2025/26 alone, against 3.9% for the least deprived decile — and the government’s own forecast has that gap widening further, to 24.6% versus 3.4%, by 2028/29.
- This rebalancing is largely invisible to the people it’s meant to help. A percentage-point shift in a funding formula doesn’t look like anything on a high street; a pothole fixed or a library reopened does.
4. The crisis that funding increases haven’t solved
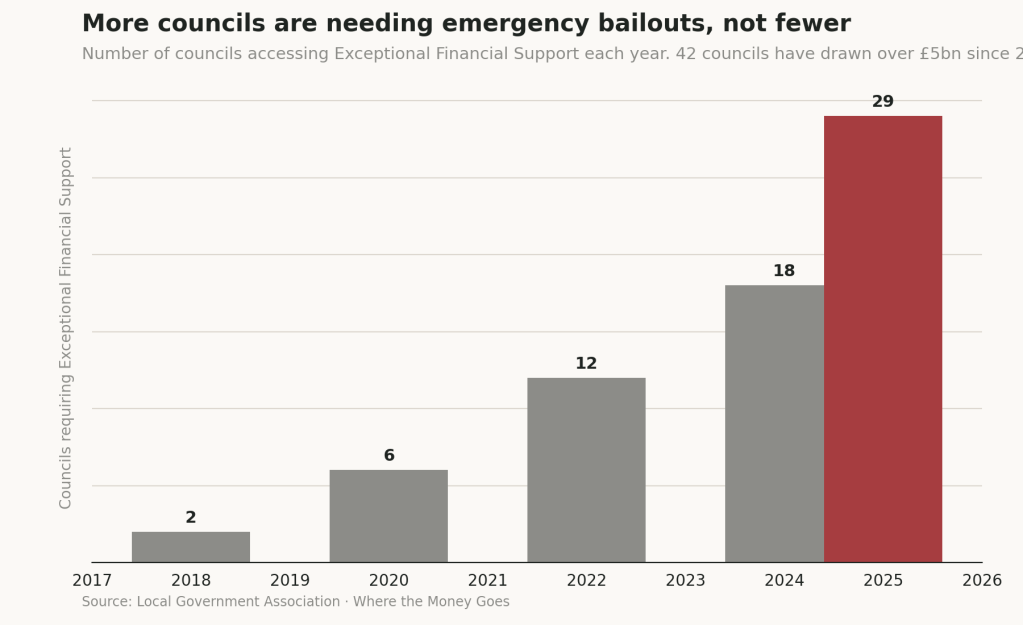
- The number of councils needing Exceptional Financial Support has risen, not fallen, despite the recent rebalancing — from 18 in 2024/25 to 29 in 2025/26. Forty-two councils have drawn over £5bn in emergency support since the mechanism began in 2020/21.
- Almost all of these councils have social care responsibilities. The demand pressure from an ageing population and rising need is currently outrunning even a genuinely improved funding settlement.
- Overspend rates make the mismatch concrete: councils overspent their budgeted allocation by an average of 25.1% on SEND transport, 51.9% on homelessness services, and 14.2% on children’s social care in the three years to 2024/25.
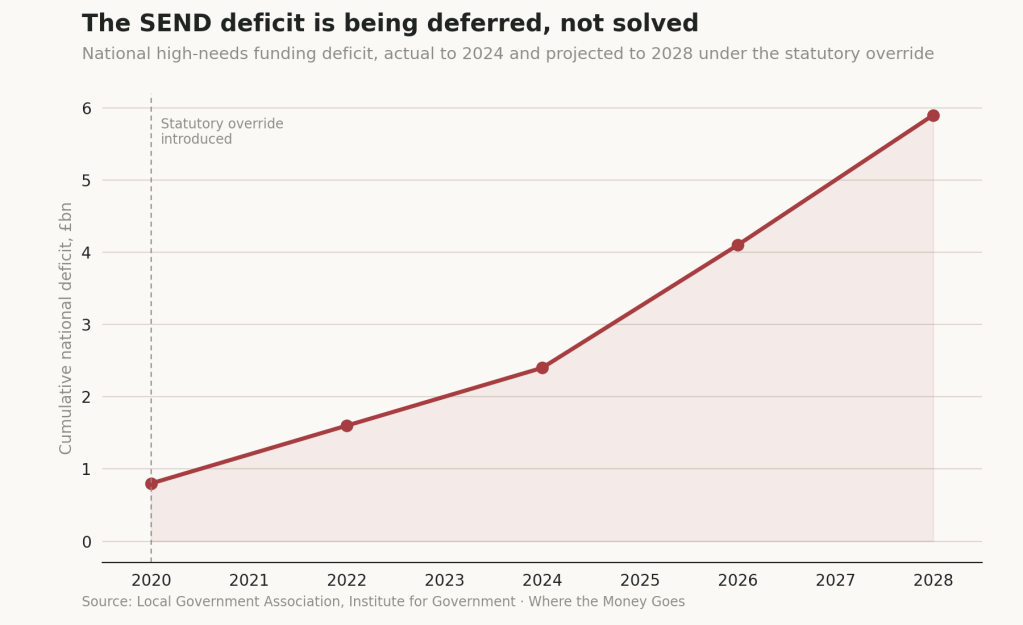
- The national SEND high-needs deficit stands at £2.4bn and is projected to reach £5.9bn. A “statutory override” has kept this deficit off council balance sheets since 2020, recently extended to April 2028 — the crisis is being deferred, not resolved.
- Without the override, roughly 18 county and unitary councils would be technically insolvent overnight, with a further 6 following within two years.
5. The one everyone can see, and mostly doesn’t know is happening
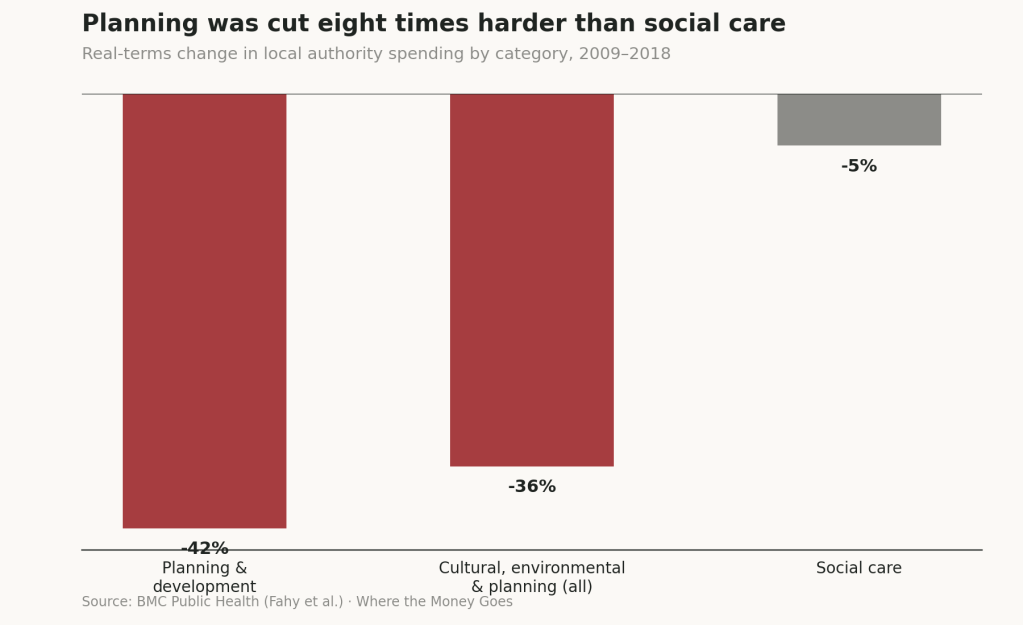
- Planning and development services were cut by 42% in real terms between 2009 and 2018 — more than eight times the 5% cut to social care over the same period. The service usually blamed for “swamping” council budgets was, relatively speaking, protected.
- The wider category of cultural, environmental and planning services fell 36% per capita in real terms over roughly the same period — the largest cut of any local government service area.
- County councils now spend on average 65% of their entire budget on adult and children’s social care combined, leaving, in their own trade body’s words, “little option” but to strip funding from parks, libraries, and planning capacity.
- Newcastle upon Tyne cut its parks budget by 97% in three years, before transferring parks out of council control entirely — an extreme example of a near-universal pattern.
6. A tax already legislated, worth watching closely
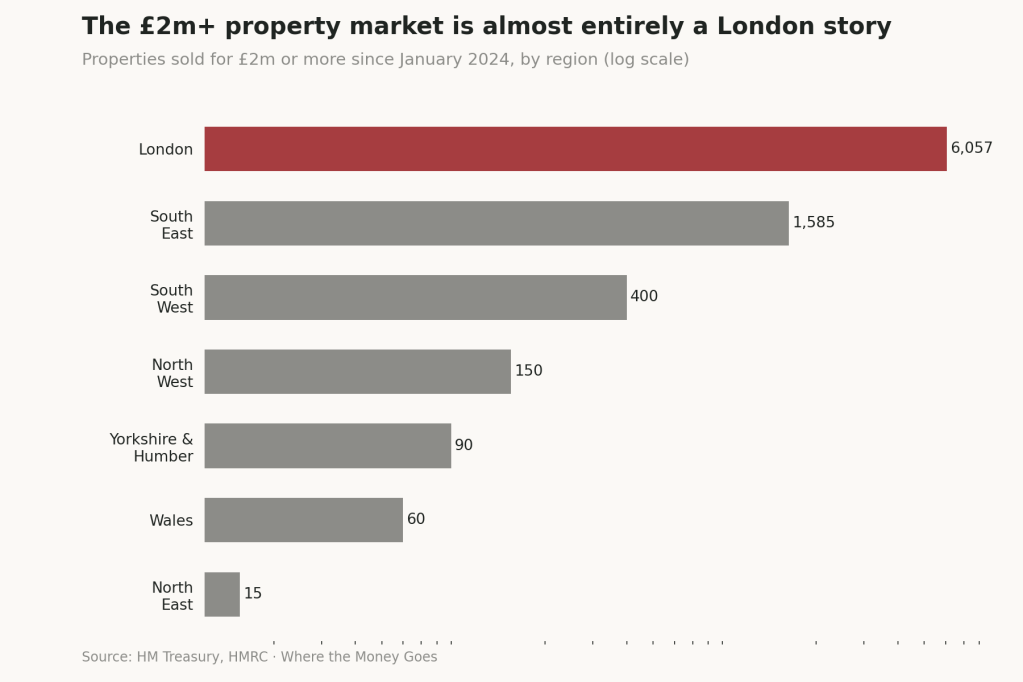
- The High Value Council Tax Surcharge, launching 2028/29, is projected to raise £430m a year from roughly 165,000 properties valued at £2m or more.
- The geography of who pays it proves the regional divide almost by accident. London alone accounts for 6,057 of the qualifying property sales since January 2024; the North East accounts for 15, across the entire region.
- The revenue currently flows to central government “to support funding for local government services” — a genuine, unresolved question is whether it should instead be explicitly earmarked and redirected toward the local government funding gap this piece has already quantified.
A note on the data
The national tax figures come from HMRC and OBR. The local government material draws on the Institute for Government, the IFS, the Local Government Association and the House of Commons Library, all independently audited sources rather than partisan analysis. Two of the charts in this piece — the Core Spending Power index (Chart 1) and the deprived/affluent rebalancing figures for the 2010s cuts era (Chart 3, left-hand bars) — are constructed from published ratios and percentage-change figures rather than a single continuous dataset, and are labelled as such; the more recent rebalancing figures (Chart 3, right-hand bars) and the SEND, EFS and HVCTS figures are direct from source.
Next in this series: Where the Spending Goes — social care, SEND, and tertiary education as the three services actually shaping the fiscal picture this piece has just laid out.


Leave a Reply