The Financial Reality of the British State: From Westminster to the Town Hall
Part Four: The Household Ledger
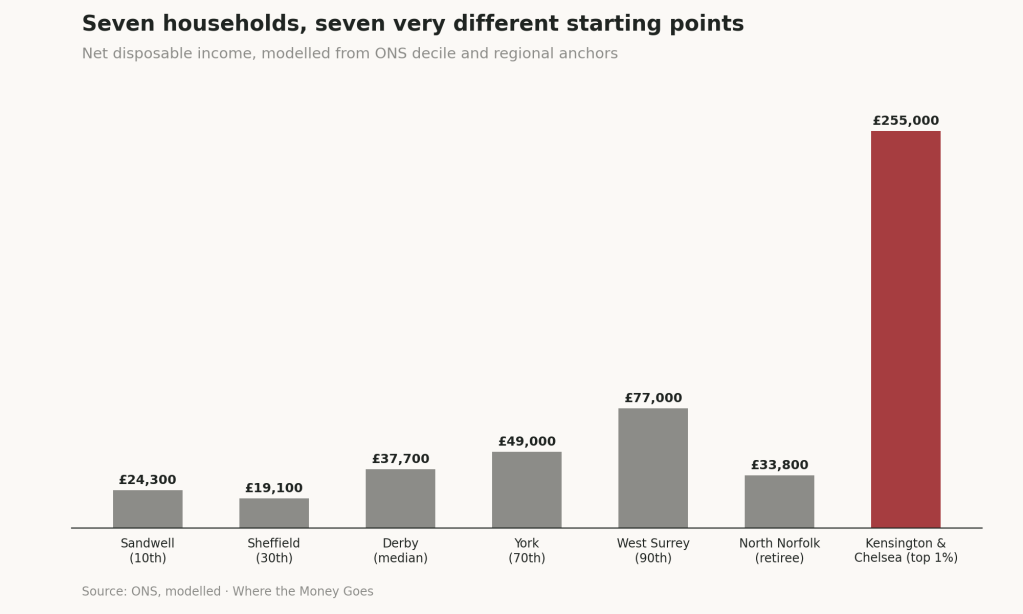
The first three pieces in this series worked in aggregates — deciles, national totals, regional averages. This piece takes those same aggregates and builds seven composite households from them: real income and wealth data, given a name, a place, and a life. None of these people exist. Every number attached to them does.
A note on the places: each household is set somewhere its income and wealth profile genuinely, typically belongs — grounded in real regional data, not chosen for effect. This isn’t a claim that poverty only exists in the North or wealth only in the South. There are poor households in Kensington and wealthy ones in Cheshire. These are typical placements, not exclusive ones.
What this piece shows, in three findings
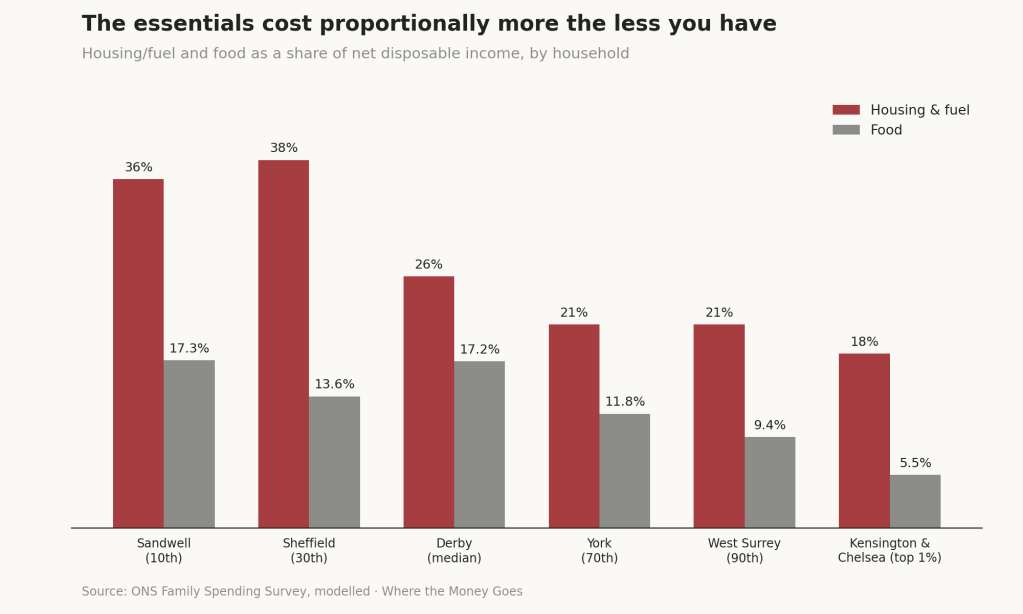
- The essentials cost proportionally more the less you have. Housing and fuel eat up over a third of income at the bottom of the ladder and under a fifth at the top — not because the poorest household spends more, but because everything else is squeezed by comparison.
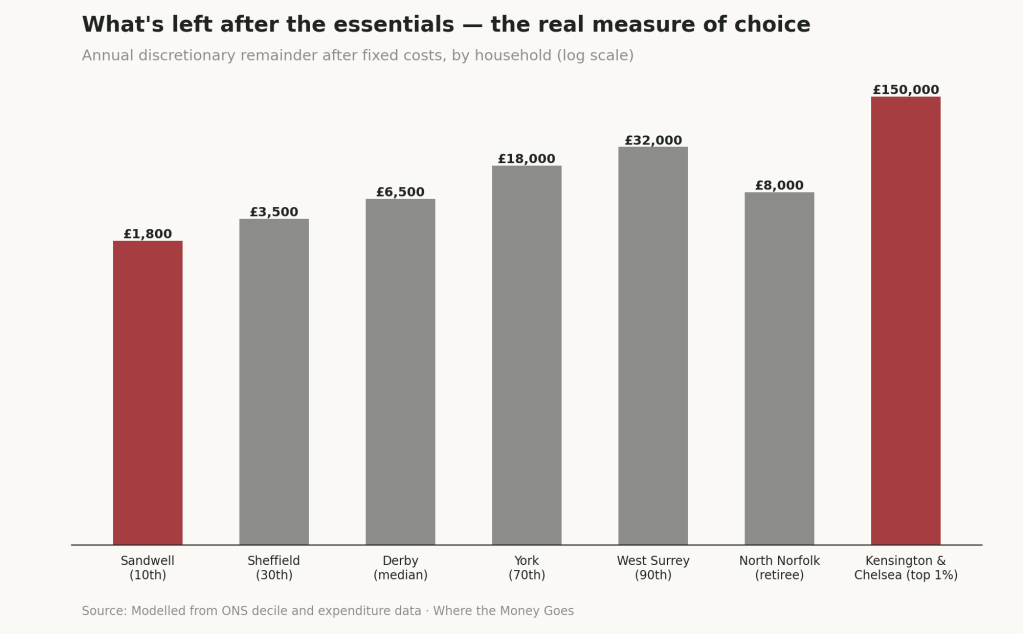
- “Choice” barely exists at the bottom of this ladder. After fixed costs, the poorest household in this set is left with roughly £35 a week for everything else life throws at it — a broken boiler, school shoes, a birthday. The wealthiest is left with roughly £2,900 a week.
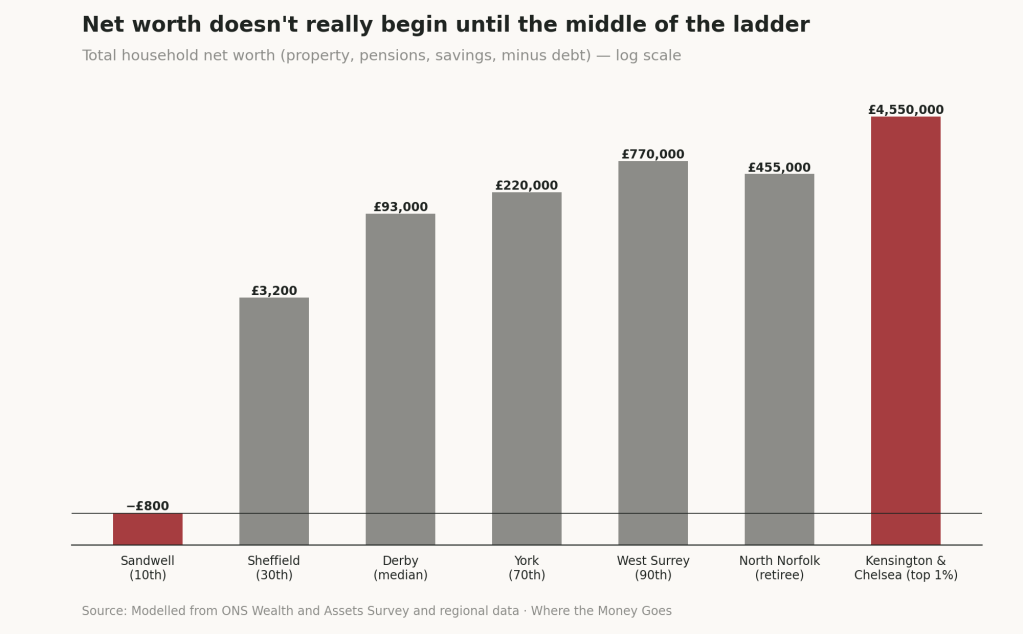
- Net worth doesn’t really begin until the middle of the ladder. The bottom two households have negative or negligible net worth despite both being in work. Below a certain point, “savings” isn’t a smaller number — it’s a concept that doesn’t yet apply.
The frame: fixed floor, insurance chunk, discretionary, and assets
Before the seven households, the frame worth holding throughout:
- The fixed floor — a roof, the power to heat and light it, water, food, a basic level of connectivity, transport to work, clothing, a minimal entertainment budget. Everyone should have this. What follows shows how thin the margin is even here.
- The insurance chunk — actual insurance, plus the buffer for when something breaks: the car failing its MOT, the boiler going in January, a new deposit when a landlord serves notice, glasses, a dental emergency, school shoes at the start of term, a cracked phone screen when it’s the only device in the house, a funeral, a vet’s bill, Christmas. This is largely invisible to anyone who has never needed it.
- Discretionary spending — a holiday, culture, gifts, charity, subscriptions, hobbies. Only from here on does spending resemble the kind of “choice” most public debate about money assumes everyone already has.
- Asset accumulation — separate from all three, and for the bottom of this ladder, functionally absent as a category.
One thing worth stating plainly, because it will be dismissed otherwise: there are people who make poor decisions with money at every income level. But for most of the people in the bottom half of this ladder, constrained choice is not a choice they are making — it is the absence of one.
1. Sandwell, West Midlands — 10th percentile
A single parent with two children, aged 6 and 9, working roughly 20 hours a week in retail at the National Living Wage. Private rented two-bedroom house.
- Gross income: £25,500 (£11,500 earnings, £14,000 in Universal Credit and Child Benefit)
- Net disposable income: approximately £24,300 before the housing shortfall below
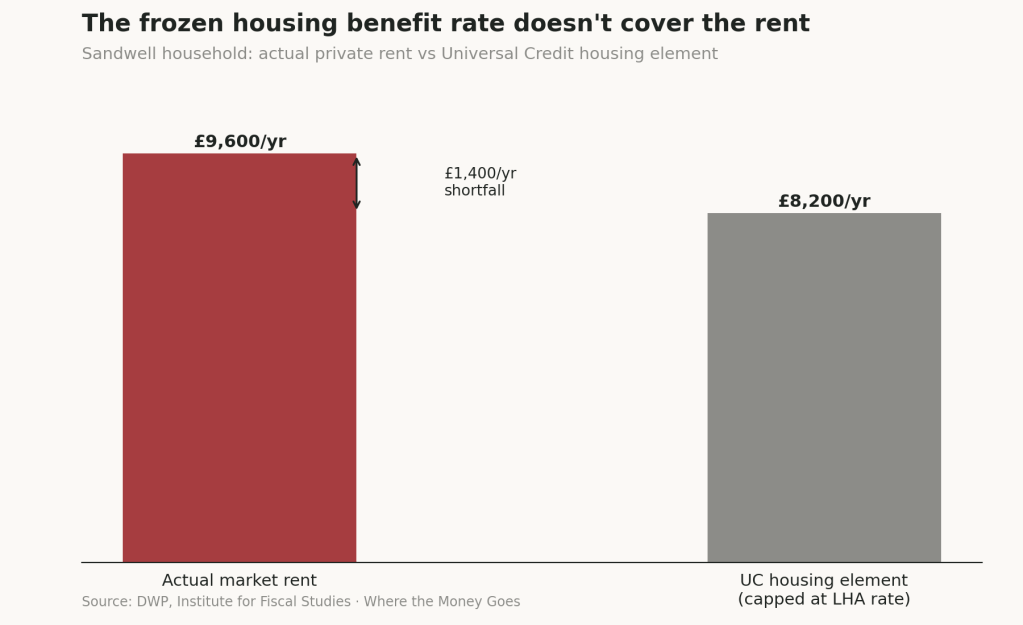
- Housing: actual market rent is £9,600 a year; Universal Credit’s housing element, capped at the frozen Local Housing Allowance rate, covers only £8,200 — leaving a £1,400 annual shortfall the household must find from everything else.
- After housing, food (17.3% of income), transport, childcare and clothing, the remainder is roughly £1,800 a year — about £35 a week — for everything not already accounted for.
- Net worth: approximately −£800. Working, raising two children, and still in the red before anything goes wrong.
2. Sheffield, South Yorkshire — 30th percentile
Single, early-career, working in retail supervision. Private rented flat-share.
- Net disposable income: approximately £19,100
- Housing takes 38% of income — renting alone is expensive relative to income at this level, even without children to support
- Food: 13.6% of income. Discretionary remainder: roughly £3,500 a year.
- Net worth: approximately +£3,200 — the point on this ladder where the number turns positive, barely.
3. Derby, East Midlands — median household
A couple with two children, one full-time and one part-time earner. Mortgaged semi-detached house. Deliberately unremarkable — this is the household the whole tax and benefit system is implicitly calibrated around.
- Net disposable income: approximately £37,700
- Housing: 26% of income. Food: 17.2% — similar in share to Sandwell despite much higher income, because there are simply more mouths to feed.
- Discretionary remainder: roughly £6,500 a year — a family holiday is possible, but it needs planning, not spontaneity.
- Net worth: approximately £93,000 — mostly property equity and early-stage pension.
4. York, North Yorkshire — 70th percentile
A couple, both working full-time in skilled or professional occupations. Mortgaged house.
- Net disposable income: approximately £49,000
- Housing: 21%. Food: 11.8%.
- Discretionary remainder: roughly £18,000 a year — genuine choice starts to appear here: holidays, saving toward a bigger mortgage, some cultural spending.
- Net worth: approximately £220,000.
5. West Surrey — 90th percentile
A couple in senior professional or managerial roles. Larger mortgage, well into paydown.
- Net disposable income: approximately £77,000
- Housing: 21% — a far larger absolute figure than Derby’s, at almost the same share. Better housing, not just more of it.
- Food: 9.4%.
- Discretionary and savings remainder: roughly £32,000 a year — private school fees or serious pension top-ups become live options.
- Net worth: approximately £770,000.
6. Kensington & Chelsea, London — top 1%
An executive or finance couple. Minimal mortgage relative to net worth; substantial investment and property portfolio.
- Net disposable income: approximately £255,000
- Housing: 18% of income — a smaller share than the median household, despite an enormous absolute figure.The regressive pattern runs in reverse at the very top.
- Food: 5.5% — Engel’s Law in action: the share of income spent on food falls steadily as income rises, even as the actual pounds spent go up.
- Discretionary and investable remainder: roughly £150,000 a year — this is where spending stops describing survival and starts describing asset accumulation.
- Net worth: approximately £4,550,000.
7. North Norfolk coast — retiree couple
State Pension plus private pension drawdown. Mortgage-free.
- Net disposable income: approximately £33,800
- Housing: 24% — no mortgage, but older housing stock and higher heating costs. Food: 16.6%.
- Discretionary remainder: roughly £8,000 a year, though health-related costs are a growing and less controllable share as the couple ages.
- Net worth: approximately £455,000, mostly property.
- A structural distinction worth holding onto: 90.1% of retired households are net recipients from the state overall, against 45.8% of non-retired households. But this is largely deferred wages returning after forty years of contributions, not a working-age transfer — a different moral category from household 1, even though both show up as “receiving benefits” in the same national statistics.
The pattern across all seven
- The share of income spent on housing and fuel falls from 36–38% at the bottom to 18% at the top. The share spent on food follows the same pattern almost exactly — Engel’s Law holding at both extremes of the same national income distribution.
- The discretionary remainder doesn’t just grow — it grows as a proportion too, from roughly £35 a week at the bottom to roughly £2,900 a week at the top.
- Net worth barely exists below the median. It isn’t a smaller version of the same thing at every rung of this ladder — for the bottom two households, it’s a category that hasn’t started yet.
A note on the data
These are modelled households — built from real ONS quintile and decile anchors (income, taxes, benefits), the IFS’s decile-level tax and benefit shares, ONS Family Spending Survey category patterns, and the ONS Wealth and Assets Survey, but interpolated between those anchors rather than pulled decile-by-decile from primary tables in every case. The regional settings are grounded in real ONS regional income data. Worth a precision pass against the primary datasets before this goes to print, in the same spirit as the corrections already made to the earlier pieces in this series.
This completes the evidential base of Where the Money Goes. What follows moves from what the data shows to what it means — the diagnosis, and then the prescription.


Leave a Reply